Key findings
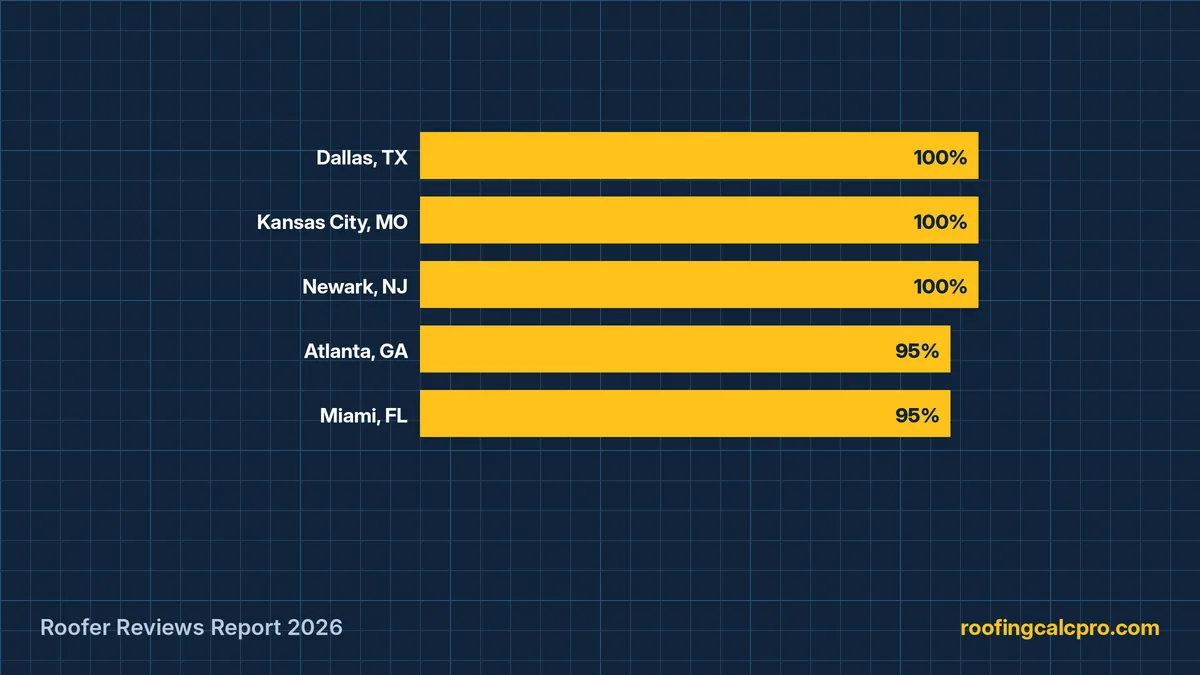
- Dallas, TX ranks #1: 100% of its most-reviewed roofers hold 4.8+ stars with 50+ reviews.
- Laredo, TX ranks last at 5%, the hardest large city in the study to find a highly trusted roofer.
- Pennsylvania leads the states with two or more cities in the study, averaging 82.5% highly trusted roofers. Nevada ranks last at 28.8%.
- The 1,903 roofers studied hold 501,559 Google reviews between them, an average rating of 4.79.
- Winston-Salem, NC has the most roofers listing 24-hour availability (75%), useful after storms.
Top 10 cities for trusted roofers
| Rank | City | Roofers | Highly trusted | Avg rating | Median reviews | Open 24 hrs |
|---|---|---|---|---|---|---|
| 1 | Dallas, TX | 20 | 100% | 4.94 | 210 | 40% |
| 2 | Kansas City, MO | 12 | 100% | 4.93 | 159 | 16.7% |
| 3 | Newark, NJ | 17 | 100% | 4.91 | 181 | 64.7% |
| 4 | Atlanta, GA | 20 | 95% | 4.89 | 207 | 40% |
| 5 | Miami, FL | 20 | 95% | 4.89 | 100 | 40% |
| 6 | New York, NY | 14 | 92.9% | 4.94 | 171 | 71.4% |
| 7 | Cincinnati, OH | 14 | 92.9% | 4.90 | 130 | 28.6% |
| 8 | Irving, TX | 20 | 90% | 4.92 | 280 | 40% |
| 9 | Frisco, TX | 20 | 90% | 4.89 | 280 | 40% |
| 10 | Plano, TX | 20 | 90% | 4.89 | 213 | 35% |
Bottom 10: hardest cities to find a trusted roofer
| Rank | City | Roofers | Highly trusted | Avg rating | Median reviews | Open 24 hrs |
|---|---|---|---|---|---|---|
| 97 | Laredo, TX | 20 | 5% | 4.55 | 20 | 10% |
| 96 | Henderson, NV | 20 | 15% | 4.32 | 21 | 5.3% |
| 95 | Honolulu, HI | 20 | 20% | 4.59 | 34 | 20% |
| 94 | Anchorage, AK | 20 | 25% | 4.51 | 29 | 5% |
| 93 | North Las Vegas, NV | 20 | 25% | 4.59 | 79 | 25% |
| 92 | Riverside, CA | 20 | 25% | 4.64 | 79 | 15% |
| 91 | Corpus Christi, TX | 20 | 25% | 4.66 | 32 | 25% |
| 90 | Las Vegas, NV | 20 | 30% | 4.61 | 97 | 10% |
| 89 | Stockton, CA | 20 | 30% | 4.69 | 35 | 25% |
| 88 | Oakland, CA | 20 | 30% | 4.83 | 44 | 23.5% |
States ranked
States with 2 or more cities in the study, averaged across their cities.
| Rank | State | Cities in study | Highly trusted (avg) | Avg rating | Top city |
|---|---|---|---|---|---|
| 1 | Pennsylvania | 2 | 82.5% | 4.85 | Pittsburgh |
| 2 | Ohio | 4 | 80.3% | 4.84 | Cincinnati |
| 3 | Oklahoma | 2 | 80% | 4.86 | Tulsa |
| 4 | Arizona | 7 | 76.4% | 4.83 | Scottsdale |
| 5 | Wisconsin | 2 | 75% | 4.80 | Madison |
| 6 | Florida | 8 | 71.9% | 4.78 | Miami |
| 7 | Indiana | 2 | 70% | 4.74 | Indianapolis |
| 8 | Missouri | 2 | 69.5% | 4.85 | Kansas City |
| 9 | Texas | 14 | 68.6% | 4.82 | Dallas |
| 10 | North Carolina | 5 | 68% | 4.80 | Winston-Salem |
| 11 | New York | 2 | 67.5% | 4.84 | New York |
| 12 | Minnesota | 2 | 67.5% | 4.80 | St. Paul |
| 13 | Kentucky | 2 | 64.4% | 4.82 | Lexington |
| 14 | California | 15 | 64% | 4.79 | San Francisco |
| 15 | Colorado | 3 | 61.7% | 4.75 | Denver |
| 16 | Virginia | 4 | 60% | 4.78 | Richmond |
| 17 | Nebraska | 2 | 56.5% | 4.74 | Omaha |
| 18 | Tennessee | 2 | 52.5% | 4.79 | Nashville |
| 19 | Nevada | 4 | 28.8% | 4.50 | Reno |
Most 24-hour roofers (storm readiness)
| Rank | City | Roofers | Highly trusted | Avg rating | Median reviews | Open 24 hrs |
|---|---|---|---|---|---|---|
| 35 | Winston-Salem, NC | 20 | 80% | 4.79 | 127 | 75% |
| 6 | New York, NY | 14 | 92.9% | 4.94 | 171 | 71.4% |
| 3 | Newark, NJ | 17 | 100% | 4.91 | 181 | 64.7% |
| 41 | San Antonio, TX | 20 | 75% | 4.83 | 148 | 57.9% |
| 54 | Oklahoma City, OK | 20 | 70% | 4.82 | 277 | 57.9% |
| 11 | Tulsa, OK | 20 | 90% | 4.89 | 184 | 55% |
| 31 | Philadelphia, PA | 15 | 80% | 4.84 | 255 | 53.3% |
| 36 | Austin, TX | 20 | 75% | 4.85 | 484 | 50% |
| 55 | Nashville, TN | 20 | 70% | 4.79 | 282 | 45% |
| 21 | Lexington, KY | 20 | 85% | 4.86 | 163 | 44.4% |
Most established roofing markets
Cities where the leading roofers have the most reviews, a sign of long-running, busy local companies.
| Rank | City | Roofers | Highly trusted | Avg rating | Median reviews | Open 24 hrs |
|---|---|---|---|---|---|---|
| 75 | Orlando, FL | 20 | 55% | 4.75 | 592 | 26.3% |
| 60 | Denver, CO | 20 | 65% | 4.75 | 494 | 26.3% |
| 36 | Austin, TX | 20 | 75% | 4.85 | 484 | 50% |
| 47 | Mesa, AZ | 20 | 75% | 4.80 | 384 | 36.8% |
| 38 | Gilbert, AZ | 20 | 75% | 4.83 | 379 | 36.8% |
| 52 | Chandler, AZ | 20 | 70% | 4.83 | 365 | 31.6% |
| 76 | Aurora, CO | 20 | 55% | 4.74 | 359 | 15.8% |
| 85 | Tampa, FL | 20 | 40% | 4.58 | 355 | 31.6% |
| 63 | Fort Wayne, IN | 20 | 65% | 4.71 | 335 | 35% |
| 69 | Norfolk, VA | 20 | 60% | 4.76 | 318 | 36.8% |
All 97 cities
Tap a column header to sort. Download the full data (CSV).
| Rank | City | Roofers | Highly trusted | Avg rating | Median reviews | Open 24 hrs |
|---|---|---|---|---|---|---|
| 1 | Dallas, TX | 20 | 100% | 4.94 | 210 | 40% |
| 2 | Kansas City, MO | 12 | 100% | 4.93 | 159 | 16.7% |
| 3 | Newark, NJ | 17 | 100% | 4.91 | 181 | 64.7% |
| 4 | Atlanta, GA | 20 | 95% | 4.89 | 207 | 40% |
| 5 | Miami, FL | 20 | 95% | 4.89 | 100 | 40% |
| 6 | New York, NY | 14 | 92.9% | 4.94 | 171 | 71.4% |
| 7 | Cincinnati, OH | 14 | 92.9% | 4.90 | 130 | 28.6% |
| 8 | Irving, TX | 20 | 90% | 4.92 | 280 | 40% |
| 9 | Frisco, TX | 20 | 90% | 4.89 | 280 | 40% |
| 10 | Plano, TX | 20 | 90% | 4.89 | 213 | 35% |
| 11 | Tulsa, OK | 20 | 90% | 4.89 | 184 | 55% |
| 12 | Seattle, WA | 20 | 90% | 4.89 | 128 | 15.8% |
| 13 | Portland, OR | 20 | 90% | 4.86 | 295 | 20% |
| 14 | Scottsdale, AZ | 20 | 85% | 4.89 | 208 | 42.1% |
| 15 | San Francisco, CA | 20 | 85% | 4.89 | 100 | 36.8% |
| 16 | Garland, TX | 20 | 85% | 4.88 | 226 | 35% |
| 17 | Columbus, OH | 20 | 85% | 4.88 | 149 | 40% |
| 18 | Pittsburgh, PA | 20 | 85% | 4.87 | 184 | 15% |
| 19 | Richmond, VA | 20 | 85% | 4.87 | 140 | 36.8% |
| 20 | Arlington, TX | 20 | 85% | 4.86 | 226 | 30% |
| 21 | Lexington, KY | 20 | 85% | 4.86 | 163 | 44.4% |
| 22 | Jacksonville, FL | 20 | 85% | 4.86 | 174 | 31.6% |
| 23 | Los Angeles, CA | 20 | 85% | 4.86 | 135 | 20% |
| 24 | Port St. Lucie, FL | 20 | 85% | 4.84 | 145 | 30% |
| 25 | Boston, MA | 20 | 85% | 4.84 | 115 | 31.6% |
| 26 | Irvine, CA | 20 | 85% | 4.83 | 123 | 27.8% |
| 27 | St. Petersburg, FL | 20 | 85% | 4.82 | 148 | 44.4% |
| 28 | Boise, ID | 20 | 80% | 4.87 | 138 | 30% |
| 29 | Chicago, IL | 20 | 80% | 4.86 | 201 | 25% |
| 30 | Cleveland, OH | 20 | 80% | 4.85 | 115 | 35% |
| 31 | Philadelphia, PA | 15 | 80% | 4.84 | 255 | 53.3% |
| 32 | San Diego, CA | 20 | 80% | 4.83 | 73 | 16.7% |
| 33 | Tucson, AZ | 20 | 80% | 4.81 | 244 | 20% |
| 34 | San Jose, CA | 20 | 80% | 4.81 | 100 | 20% |
| 35 | Winston-Salem, NC | 20 | 80% | 4.79 | 127 | 75% |
| 36 | Austin, TX | 20 | 75% | 4.85 | 484 | 50% |
| 37 | Houston, TX | 20 | 75% | 4.84 | 199 | 40% |
| 38 | Gilbert, AZ | 20 | 75% | 4.83 | 379 | 36.8% |
| 39 | Phoenix, AZ | 20 | 75% | 4.83 | 274 | 35% |
| 40 | Long Beach, CA | 20 | 75% | 4.83 | 77 | 30% |
| 41 | San Antonio, TX | 20 | 75% | 4.83 | 148 | 57.9% |
| 42 | Raleigh, NC | 20 | 75% | 4.82 | 229 | 40% |
| 43 | Madison, WI | 20 | 75% | 4.82 | 218 | 36.8% |
| 44 | Glendale, AZ | 20 | 75% | 4.82 | 195 | 40% |
| 45 | St. Paul, MN | 20 | 75% | 4.81 | 167 | 35% |
| 46 | Baltimore, MD | 20 | 75% | 4.80 | 181 | 21.1% |
| 47 | Mesa, AZ | 20 | 75% | 4.80 | 384 | 36.8% |
| 48 | Santa Ana, CA | 20 | 75% | 4.79 | 122 | 25% |
| 49 | Milwaukee, WI | 20 | 75% | 4.78 | 152 | 20% |
| 50 | Indianapolis, IN | 20 | 75% | 4.76 | 264 | 20% |
| 51 | Sacramento, CA | 20 | 70% | 4.83 | 114 | 20% |
| 52 | Chandler, AZ | 20 | 70% | 4.83 | 365 | 31.6% |
| 53 | Fort Worth, TX | 20 | 70% | 4.82 | 196 | 36.8% |
| 54 | Oklahoma City, OK | 20 | 70% | 4.82 | 277 | 57.9% |
| 55 | Nashville, TN | 20 | 70% | 4.79 | 282 | 45% |
| 56 | Wichita, KS | 20 | 70% | 4.79 | 217 | 20% |
| 57 | Hialeah, FL | 20 | 70% | 4.79 | 211 | 5.3% |
| 58 | Greensboro, NC | 20 | 65% | 4.79 | 188 | 40% |
| 59 | Fresno, CA | 20 | 65% | 4.76 | 104 | 26.3% |
| 60 | Denver, CO | 20 | 65% | 4.75 | 494 | 26.3% |
| 61 | Colorado Springs, CO | 20 | 65% | 4.75 | 300 | 26.3% |
| 62 | Anaheim, CA | 20 | 65% | 4.75 | 125 | 20% |
| 63 | Fort Wayne, IN | 20 | 65% | 4.71 | 335 | 35% |
| 64 | Toledo, OH | 19 | 63.2% | 4.72 | 207 | 5.3% |
| 65 | New Orleans, LA | 20 | 60% | 4.82 | 96 | 36.8% |
| 66 | Charlotte, NC | 20 | 60% | 4.79 | 309 | 40% |
| 67 | Minneapolis, MN | 20 | 60% | 4.79 | 204 | 25% |
| 68 | Durham, NC | 20 | 60% | 4.79 | 87 | 21.1% |
| 69 | Norfolk, VA | 20 | 60% | 4.76 | 318 | 36.8% |
| 70 | Cape Coral, FL | 20 | 60% | 4.70 | 144 | 20% |
| 71 | Omaha, NE | 19 | 57.9% | 4.70 | 184 | 38.9% |
| 72 | Chula Vista, CA | 20 | 55% | 4.86 | 64 | 11.8% |
| 73 | Lincoln, NE | 20 | 55% | 4.77 | 124 | 31.6% |
| 74 | Virginia Beach, VA | 20 | 55% | 4.75 | 118 | 10% |
| 75 | Orlando, FL | 20 | 55% | 4.75 | 592 | 26.3% |
| 76 | Aurora, CO | 20 | 55% | 4.74 | 359 | 15.8% |
| 77 | Bakersfield, CA | 20 | 55% | 4.66 | 81 | 5.6% |
| 78 | Lubbock, TX | 20 | 50% | 4.83 | 67 | 5.3% |
| 79 | Albuquerque, NM | 20 | 45% | 4.67 | 253 | 35% |
| 80 | El Paso, TX | 20 | 45% | 4.67 | 112 | 10% |
| 81 | Reno, NV | 20 | 45% | 4.46 | 61 | 5% |
| 82 | Louisville, KY | 16 | 43.8% | 4.78 | 132 | 25% |
| 83 | Buffalo, NY | 19 | 42.1% | 4.74 | 142 | 36.8% |
| 84 | Chesapeake, VA | 20 | 40% | 4.76 | 153 | 38.9% |
| 85 | Tampa, FL | 20 | 40% | 4.58 | 355 | 31.6% |
| 86 | St. Louis, MO | 18 | 38.9% | 4.77 | 104 | 33.3% |
| 87 | Memphis, TN | 20 | 35% | 4.79 | 43 | 35% |
| 88 | Oakland, CA | 20 | 30% | 4.83 | 44 | 23.5% |
| 89 | Stockton, CA | 20 | 30% | 4.69 | 35 | 25% |
| 90 | Las Vegas, NV | 20 | 30% | 4.61 | 97 | 10% |
| 91 | Corpus Christi, TX | 20 | 25% | 4.66 | 32 | 25% |
| 92 | Riverside, CA | 20 | 25% | 4.64 | 79 | 15% |
| 93 | North Las Vegas, NV | 20 | 25% | 4.59 | 79 | 25% |
| 94 | Anchorage, AK | 20 | 25% | 4.51 | 29 | 5% |
| 95 | Honolulu, HI | 20 | 20% | 4.59 | 34 | 20% |
| 96 | Henderson, NV | 20 | 15% | 4.32 | 21 | 5.3% |
| 97 | Laredo, TX | 20 | 5% | 4.55 | 20 | 10% |
Methodology
For each of the 97 most populous US cities we pulled the 20 most-reviewed roofing contractors with a claimed Google Business Profile within 12 km of downtown, using Google Maps data via DataForSEO, collected on 2026-10-16. We removed unclaimed listings and roofers whose address is in a different state or country, then excluded cities left with fewer than 10 roofers: Detroit, MI, Jersey City, NJ, Washington, DC. States are ranked only when 2 or more of their cities are in the study.
- Highly trusted: rated 4.8 stars or higher with at least 50 reviews.
- Ranking: share of highly trusted roofers, then average rating, then median review count.
- Open 24 hrs: share of roofers whose listed hours show open 24 hours, among those that list hours.
Limits: neighboring cities in large metros can share roofers. Ratings change daily. This measures public reputation on Google, not workmanship.
Use this data
Journalists, bloggers and researchers can use this report for free. Please cite RoofingCalc Pro Roofer Reviews Report 2026 and link to this page. Embed the chart:
Media questions or a city-level breakdown: see our press kit.
Hiring a roofer?
Compare the top rated roofers in your area on our roofing companies by city pages, and price the job first with the roof replacement cost calculator.
Frequently asked questions
Which US city has the best rated roofers?
Dallas, TX ranks first in the Roofer Reviews Report 2026, with 100% of its most-reviewed roofers rated 4.8 stars or higher with at least 50 reviews.
How many roofers were analyzed?
1,903 roofing contractors across 97 cities, with 501,559 Google reviews in total.
Can I use this data in an article?
Yes. Cite and link to this page as the source. You can also embed the chart or download the full data as a CSV.